
Hi All,
I have a list in sharepoint which we are looking to summarise in the following format
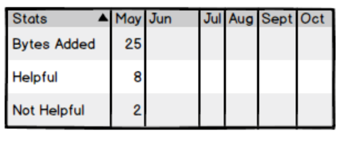
The list has columns for month, helpful, unhelpful but am struggling to find a way to display in this format grouping entries together in a sum per month, any ideas?
One way that I have addressed a similar need it to export the list to Excel and save the spreadsheet to a SP library. Set the data connections on the Excel file so it refreshes on open. Then create a pivot table from the data on a new tab. Each time you open the spreadsheet it will update with any new or edited information from the list. This opens up all kinds of options for reporting yet still allows your users easy entry of information on the list.
Number of list items per month so each is a “byte” or piece of knowledge
I think that would work too Paul, columns I’ve added are as follows;
Month (Choice)
Details (Rich)
Sector (Choice)
Helpful (Yes/No)
I’m open to changing these but can’t find a way to sum all entries into a single row as per the image
The picture isn’t quite enough information. What kind of columns are those? Would you be open to having months as rows instead of columns?