
Can we create a pie chart using excel reporting service. I have a excel file (.xlsx) on my SharePoint document library. I want to use excel data and create a pie chart but don’t want to create this pie chart in excel.
I have created a pie chart in excel and show this chart on my site using excel web access web part but my client don’t want to use this approach. Please suggest any different way to create pie chart from excel and display on web site.
Is it possible to pick the data from a excel file (.xlsx), generate report and display it on SharePoint site.
If it is not possible then please suggest the right way to achieve the same.
Hi All,
After exploration I got the solution.
We need to save page before connect chart web part to data source.
when we save page the web part will add on page and then we can configure it with data source without edit the page.
Thank You 🙂
Hi,
As you suggested I import excel sheet in a list and using list as data source of chart web part.
I am using chart web part in SharePoint 2013 to create pie chart, but web part automatically removing from page when I click on finish button after step 4: bind chart to data. 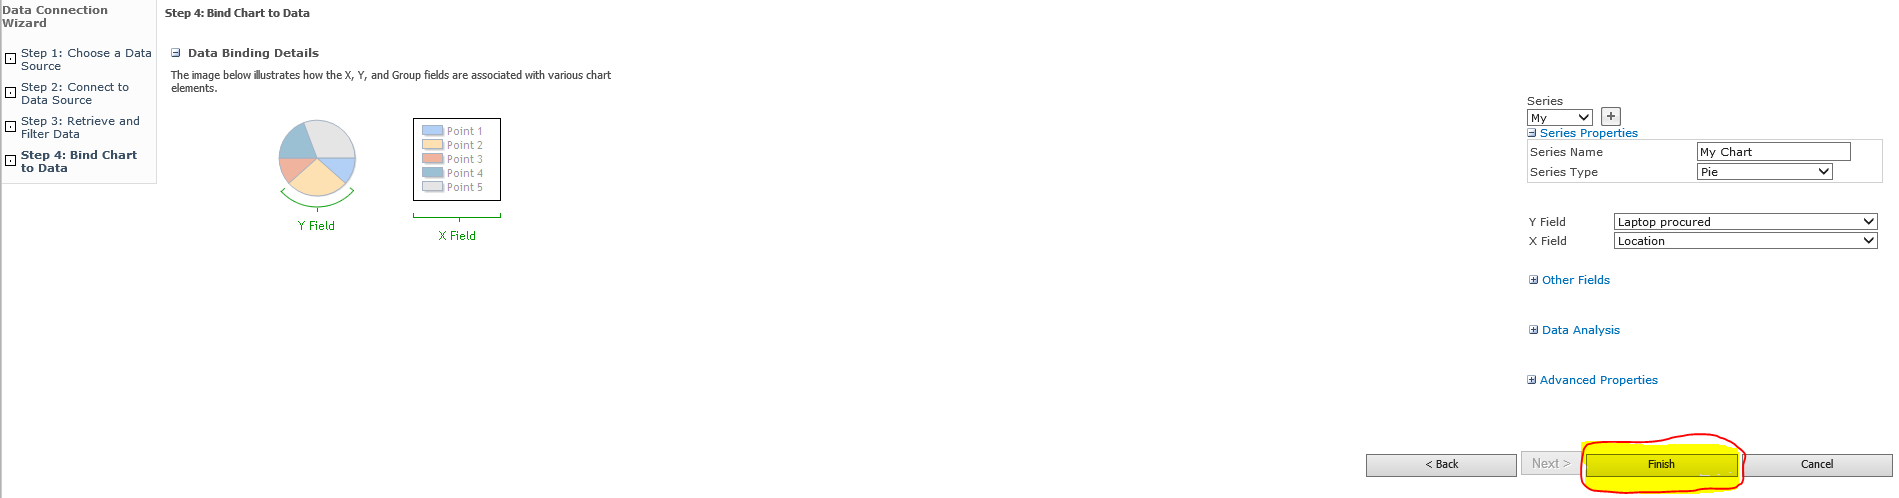
?width=721
I follow this link to use chart web part but get an exception. I am using a publishing document.
How can I resolve this?
Hi Ansul,
Why don’t you sync your excel sheet with SharePoint List and use List to create pie chart using SP Services or REST API. you can use SP Service or REST in Script editor or CEWP and load your chart on pageload. Many JQuery Plugin available for Pie chart just you have to use with REST or SP Services.
If you are looking for automated Service to display the data in Pie Chart I would suggest you to use to ChartWeb Part Using Excel Service to display Pie Chart. pls check below links.
http://www.dotnetcurry.com/sharepoint/816/display-charts-sharepoint-2010-excel-services-webparts