Hi all.
I’m in need of a method to add a chart to my landing page that will show me the count of values in a column from a list.
The list is Jobs, the column is Current Task. There are 7 different values that can be in the Current Task column. I need a chart web part that will count the occurrences of each different value. I have it working, with the Current Task column as a lookup to a TaskCount list where the 7 items are in the Title column. Then there is a lookup column in the TaskCount list which looks up the Current Task (link to count) column in the Jobs list.
That all works fine, BUT the problem is, the Current Task column is not updated by a user. It’s updated by a Nintex workflow. As we work through the workflow from step to step, the Current Task is updated automatically on the item.
I haven’t found a way for Nintex to be able to update a lookup column.
So either I leave the Current Task as a lookup and the chart works, or I change the Current Task to single line of text and the workflow can update it, but the chart is broken.
I need a way to count the instances of each possible task, but allow Nintex workflow to update the Current Task column.
Help please?
Keith
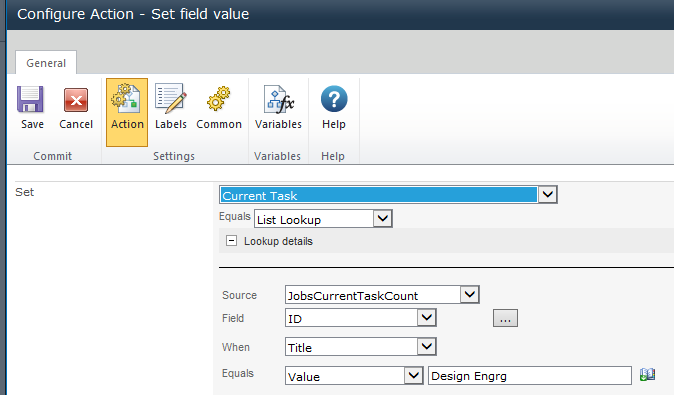
We didn’t have the parameters set correctly in the Set Item Value action block. We we just trying to set ‘value’ were we now have ‘list lookup’ The chart works now and the Nintex workflow updates the Current Task field in the Jobs list.